In this eSpark research study, completion of eSpark lessons is found to correlate with an increased rate of students meeting their NWEA MAP Growth goals, achieving a higher conditional growth percentile, and achieving a higher conditional growth index.
Background
The NWEA MAP Growth Assessment is used by nearly half of all districts in the United States to measure achievement results and gain deeper insights into student performance. NWEA reports that while students are indeed rebounding back from declines in achievement during the COVID-19 pandemic, student achievement still remains lower than in a typical year, and full recovery is still several years away. What’s more, growth is disproportionate across school years, with younger students experiencing the largest reading achievement gap and taking longer to get back to pre-pandemic levels.
Data Scientists at eSpark sought to answer three questions:
- Does using eSpark increase students’ chances of meeting their growth goals, as measured by NWEA MAP Growth?
- Does using eSpark increase students’ likelihood of achieving a higher conditional growth index, as measured by NWEA?
- Does using eSpark increase students’ chances of achieving a higher conditional growth percentile, as measured by NWEA?
Methodology
For this research study, NWEA MAP Growth Assessment scores from Fall 2021 and Spring 2022 were collected from schools and districts across the U.S. that used eSpark Premium during this time. In total, data was gathered from 11,124 students from 56 schools in Ohio, Michigan, Massachusetts, and Arizona. Data spanned grades 1 through 5 and included a diverse and representative pool of students with respect to race, ethnicity, and socioeconomic status.
To measure eSpark usage, researchers looked at the grade-level domains students had worked on during the selected time frame. A grade-level domain in eSpark is a group of related standards aligned to an overarching theme, like “1st Grade Geometry.” If a student passed 50% or more of the lessons within a grade-level domain, they were counted as having completed that domain.
To measure student growth, researchers looked at three individual metrics provided by NWEA: Met Growth Goal, Conditional Growth Index, and Conditional Growth Percentile Rank.
- Met Growth Goal is a categorical “yes or no” measure of whether a student met the specific growth goal that was set for them based on their Fall MAP Growth scores. These goals are individualized for each student and are evaluated against their Spring test performance.
- Conditional Growth Index is a numeric representation of a student’s growth from Fall to Spring. Think of it as a scale going from approximately -5 to 5, where students who are growing on pace with expectations would be clustered around zero. A score of -5 means a student demonstrated significantly less growth than expected, while a score of 5 shows significantly more growth.
- Conditional Growth Percentile is also a numeric representation of a student’s growth from Fall to Spring, but shown as a percentile rank based on NWEA’s normed data. Zero is the lowest percentile of conditional growth, 50 can be considered average conditional growth, and 100 is the highest percentile of conditional growth, meaning a student that scores in this percentile has grown more than all other peers in NWEA’s data set.
Results
Research Question #1: DOES USING ESPARK INCREASE STUDENTS’ CHANCES OF MEETING THEIR GROWTH GOALS AS MEASURED BY NWEA?
Researchers found that using eSpark does increase the likelihood students will meet their growth goals on the NWEA MAP Growth Assessment. NWEA reports that in general, 50% of students meet or exceed their projected growth goal. Of the students in the sample, analysis showed that 57.5% met their growth goal. In math, 60.3% of students met their growth goal, while 54.4% met their reading growth goal.
Students who completed more lessons in eSpark were more likely to meet their growth goal consistently in both subjects. This correlation was observed across all grade levels, and was particularly strong among 1st graders.
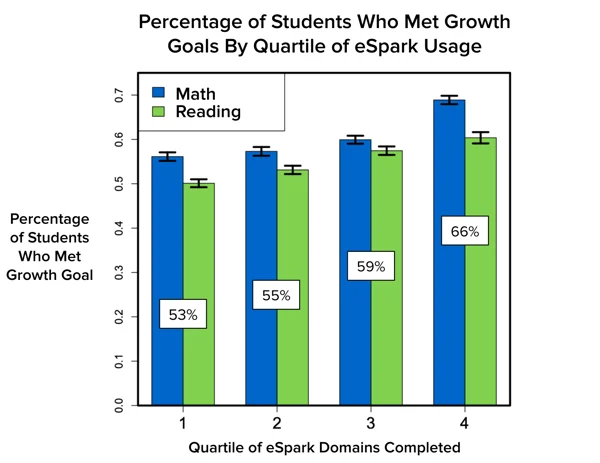
In the chart above, students were placed in quartiles representing less eSpark usage to more eSpark usage. As eSpark usage increases from left to right, the percentage of students who met their growth goals also increases in both math and reading.
RESEARCH QUESTION #2: DOES USING ESPARK INCREASE STUDENTS’ LIKELIHOOD OF ACHIEVING A HIGHER CONDITIONAL GROWTH INDEX?
Researchers found that students who use eSpark are more likely to achieve a higher conditional growth index. Each additional grade-level domain that students complete in eSpark corresponds to an average increase of about .05 standard deviations of growth on the NWEA MAP Growth Assessment. Furthermore, this correlation is stronger and more positive for younger students, the group most in need of additional support post-pandemic.
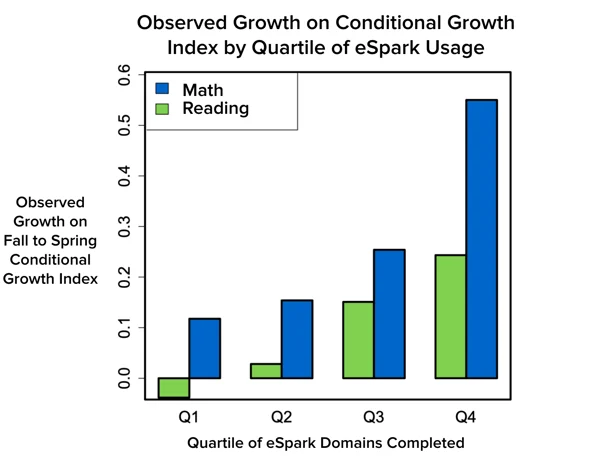
In the chart above, students were placed in quartiles representing less eSpark usage to more eSpark usage. As eSpark usage increases from left to right, students demonstrate increasingly higher Conditional Growth Index scores.
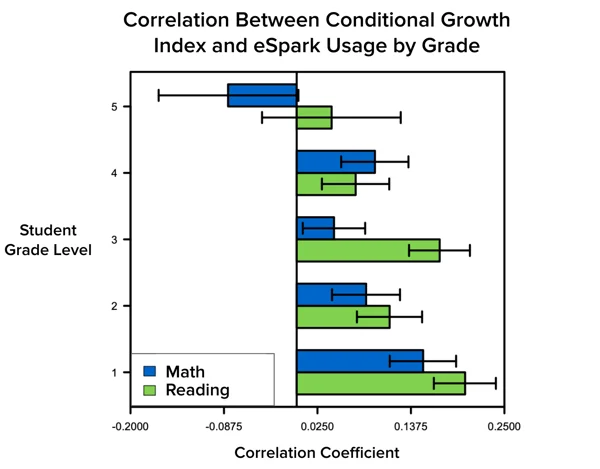
The chart above shows the correlation between eSpark usage and students’ conditional growth index in both math and reading, by grade level. Correlations are strongest and most positive for younger students (X²(4) = 38.8, p < .001).
RESEARCH QUESTION #3: DOES USING ESPARK INCREASE STUDENTS’ CHANCES OF ACHIEVING A HIGHER CONDITIONAL GROWTH PERCENTILE?
Researchers found that using eSpark does increase the likelihood students will achieve a higher conditional growth percentile. Each additional grade-level domain that students complete in eSpark correlates to an average increase of about 1 percentile rank unit on the NWEA MAP Growth Assessment. Again, the correlation also tended to be stronger and more positive for younger students, who have the most ground to make up post-pandemic.
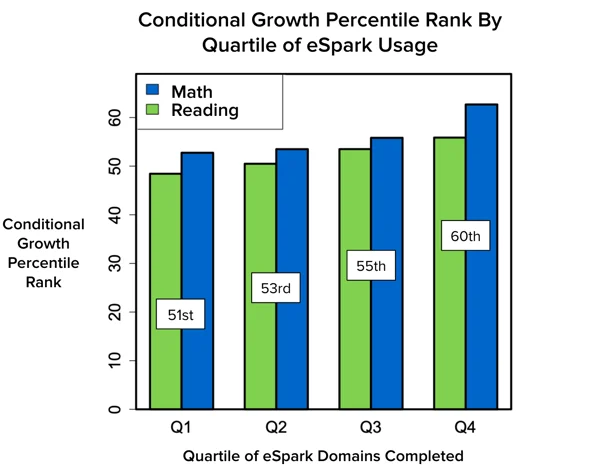
In the chart above, students were placed in quartiles representing less eSpark usage to more eSpark usage. As eSpark usage increases from left to right, students’ Conditional Growth Percentile rank also increases.
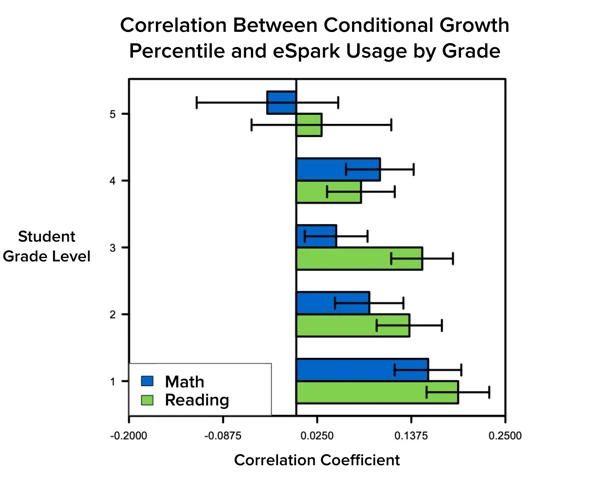
The chart above shows the correlation between eSpark usage and students’ conditional growth percentile rank in both math and reading, by grade level. Correlations are strongest and most positive for younger students (X²(4) = 24.5, p < .001).
Significance
In summary, students who complete more lessons in eSpark are projected to demonstrate higher growth as measured by several student-specific metrics provided by NWEA. Students who completed more lessons in eSpark were more likely to meet their growth goal across all grade levels, and in both subjects. They were also more likely to achieve both a higher conditional growth index and a higher conditional growth percentile as their eSpark usage increased.
These results were seen across different demographics, regions, and baseline abilities, evidence that eSpark’s playfully personalized approach to learning works to generate gains for all students regardless of circumstance or background. Perhaps even more crucially, the strongest gains are projected in younger grade levels, meaning the students who have the most room to grow post-pandemic are set up for the most success with eSpark.
Request more information about eSpark and related research on our contact page.
← Go back to eSpark’s research and evidence base overview